Engineered for
Rigorous Science.
NovoNumeric replaces complex command-line tools with a native, visually intuitive interface without sacrificing mathematical precision.
Predictive Modeling
Logistic Regression
Binary outcome modeling using the Newton-Raphson (IRLS) algorithm for convergence on unscaled data.
- Odds Ratios & Log-Likelihood
- ROC Curve Generation
- Classification Tables
Multiple Linear Regression
OLS regression powered by SVD/LU decomposition to handle collinear predictors gracefully.
- VIF (Variance Inflation Factor)
- R-Squared & Adjusted R²
- Residual Analysis Plots
Poisson Regression
Generalized Linear Model (GLM) for modeling count data and contingency tables.
- Log-Link Function
- Rate Ratio Calculation
- Handling of skewed distributions
Hypothesis Testing
Means Comparison (ANOVA & T-Tests)
Rigorous testing for normally distributed data. Includes Welch's correction for unequal variances.
Rank-Based Statistics
Robust methods for ordinal data or non-normal distributions. Uses Average Rank handling for ties.
Specialized Analytics
Power Analysis
Calculate required sample sizes (A Priori) for T-Tests using G*Power methodologies.
Reliability
Cohen's Kappa for inter-rater agreement and Bland-Altman plots for method comparison.
Survival
Kaplan-Meier estimator handling right-censored data with survival curve generation.
Multivariate
Factor Analysis (PCA) with Scree Plots and K-Means Clustering for segmentation.
Built for Big Data.
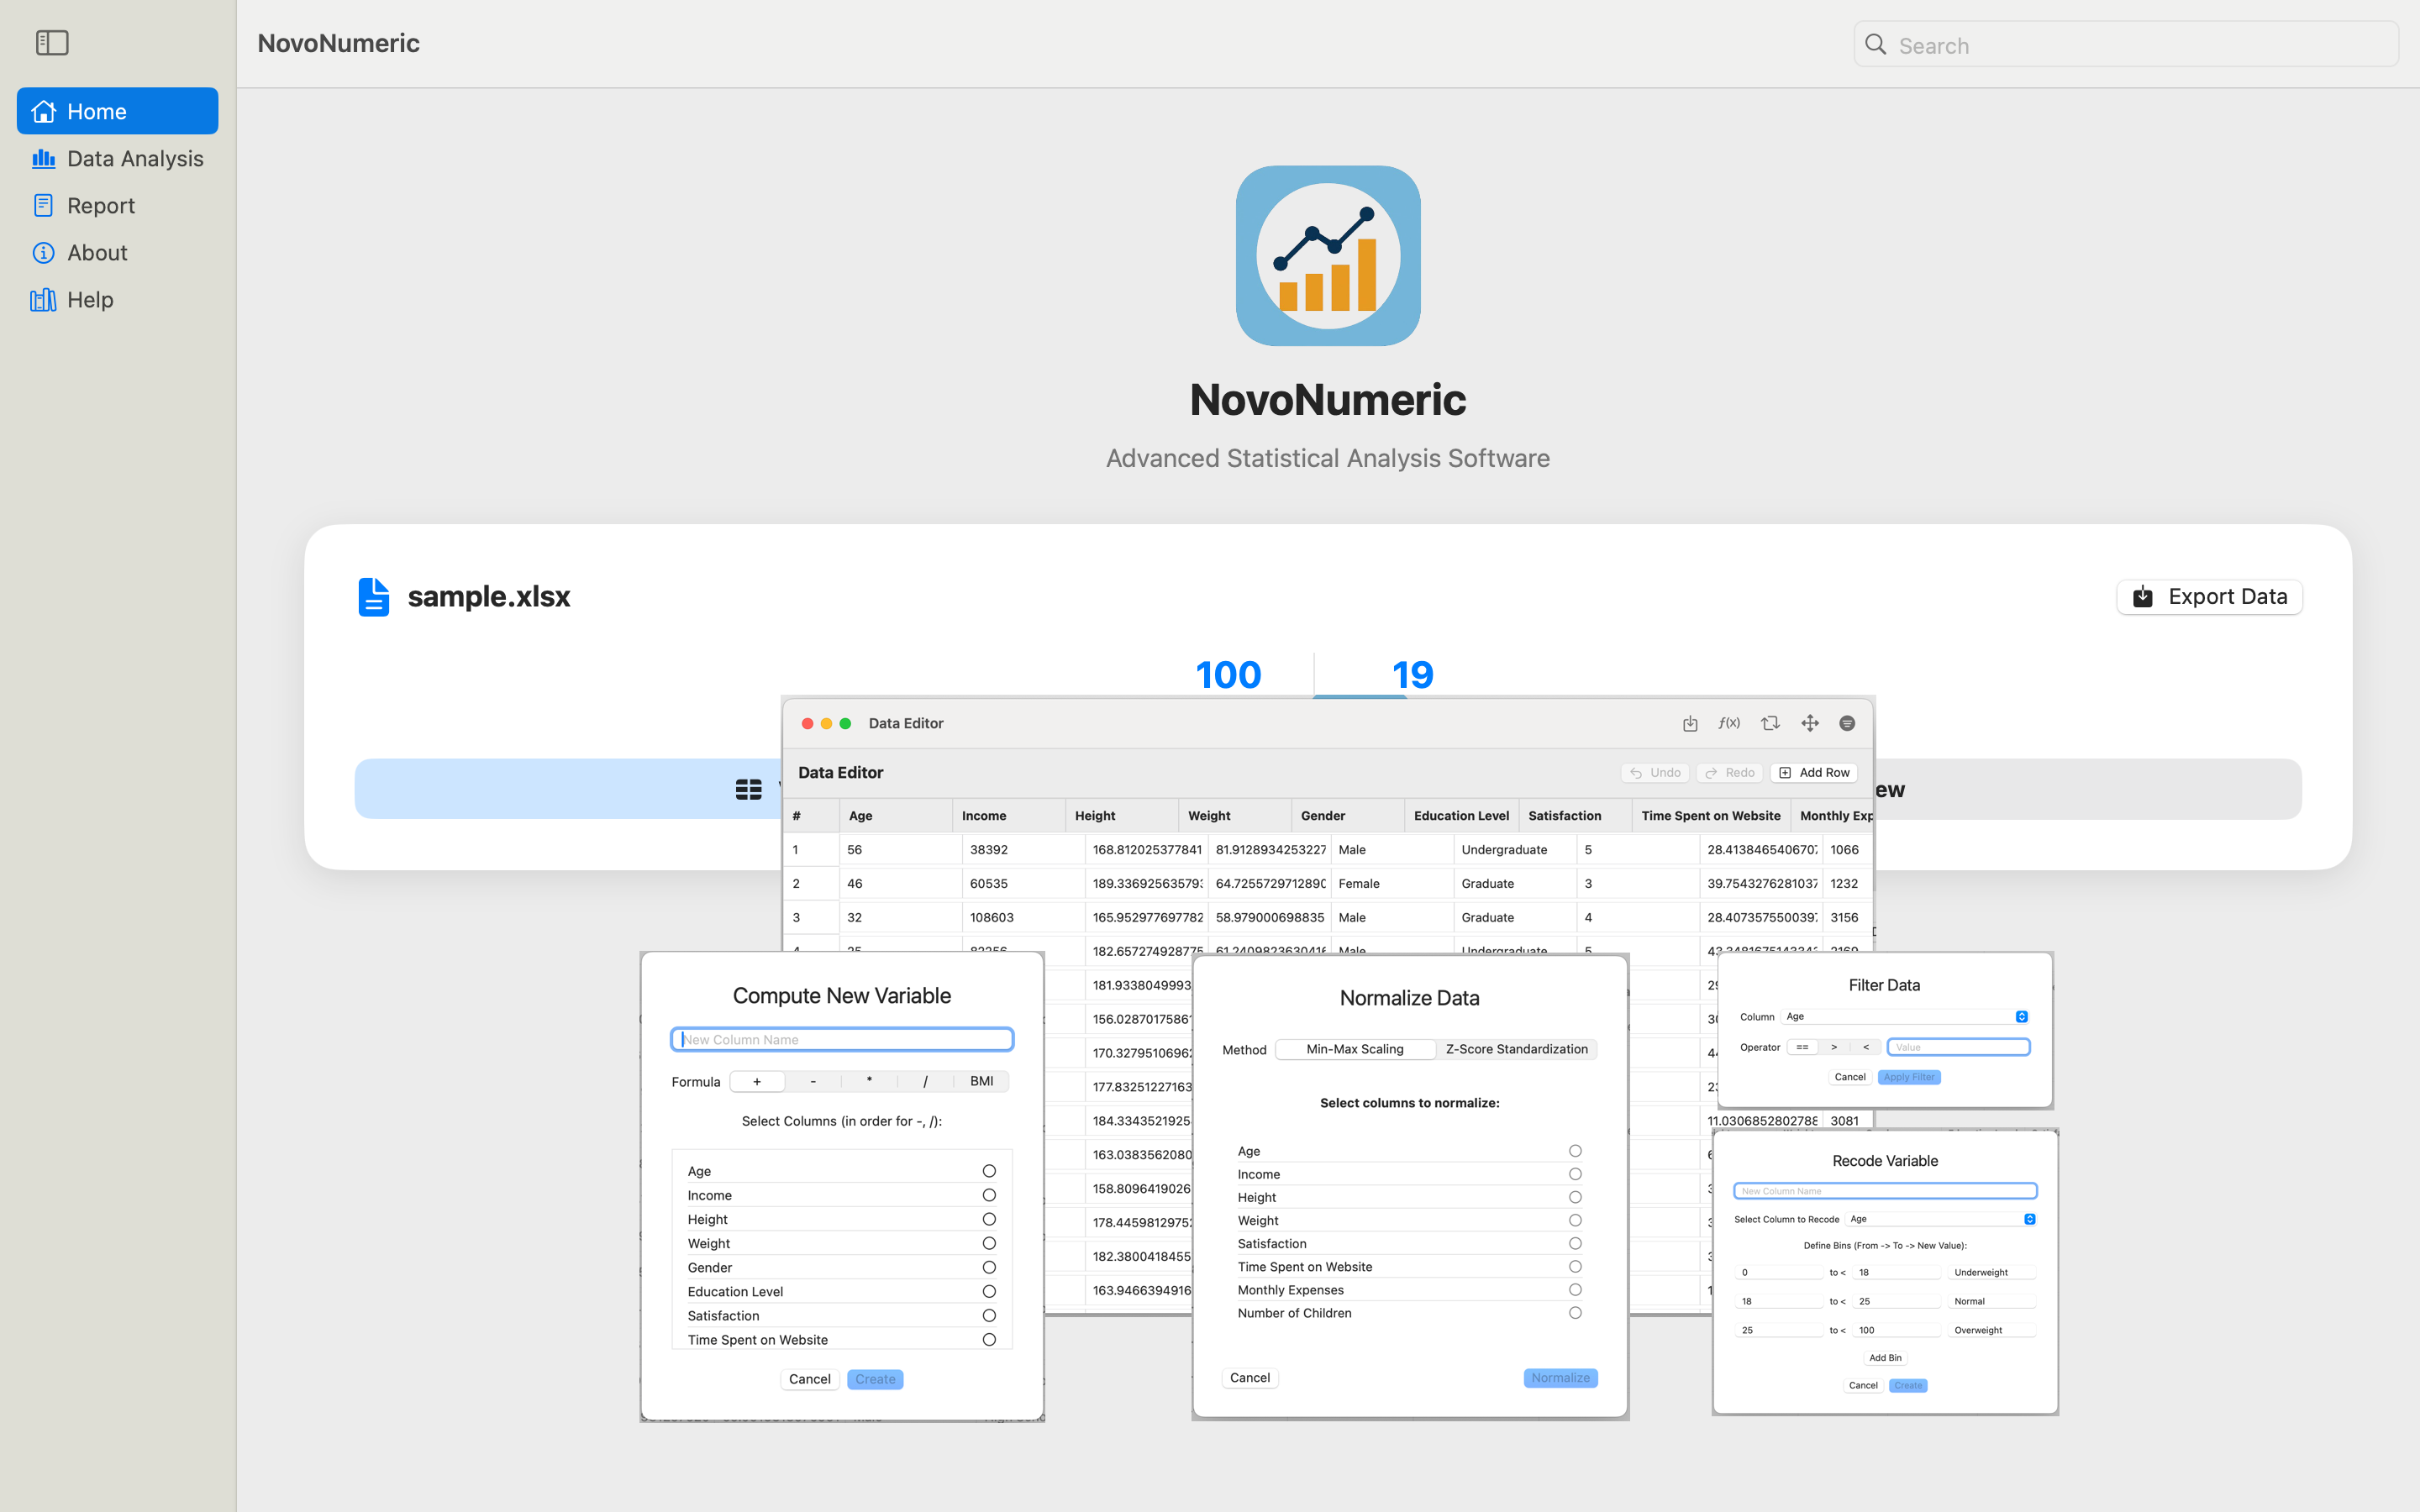
Most Mac statistics apps are wrappers around Python or Java. NovoNumeric is different. We use Async Loading and Grand Central Dispatch to process large CSV/Excel files without blocking the UI.
- Local-First: Zero data leaves your device.
- Listwise Deletion: Auto-filters missing values.
- Transformation: Recode, Compute, & Normalize.